Expected Threat(xT)
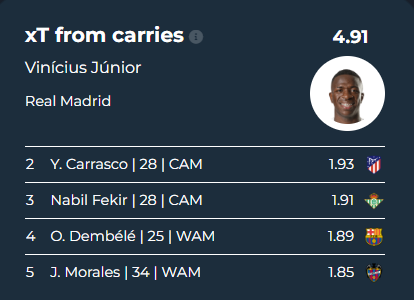
In the world of Football Analytics/Metrics there are many advanced stats such as xG(Expected Goals) and xA(Expected Assists) just to name some. A relatively new analytic is emerging-Expected Threat. According to driblab, Expected Threat measures how the probability of scoring a goal changes before the action and after it, giving value to actions that lead your team towards more dangerous situations. Essentially it measures the value of a pass/dribble/carry towards a teams chances of scoring a goal. xT can have a positive and negative value.
 |
| The Athletic |


Despite most people criticising Messi in the 2021/22 season with PSG, he still remained an elite ball progressor both from carries and passes.
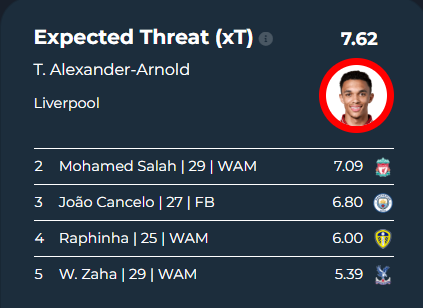
Trent had the highest xT in the top 5 leagues this season most of that coming from passes(crosses) while his team-mate Salah had the 2nd highest. Shows how valuable both are for this Liverpool team.
xT is a very useful metric and its use will truly change football analysis.

Comments
Post a Comment